Queens
Sunnyside
140 closed sales · last 12 months
Updated monthly from closed-sale data.
Sunnyside is a neighborhood in Queens with a median sale price of $565,000 and a price per square foot of $707.48. The area saw 147 sales annually, with properties typically spending 129 days on the market.
Over the last 12 months, Sunnyside has kept pace with Queens it sits within.
Median Price
$575K
Half of sales closed above this price, half below.
Price / SF
$725/SF
Median closed price per square foot.
Closed Sales
140
Number of closed sales in the period.
Price Trend
Last 12 monthsClosed Sales
Who lives here
- 149,377
- Residents
- $87K
- Median household income
- $2K/mo
- Median rent
Source: U.S. Census (ACS), 2023 · Sunnyside (3 ZIP codes)
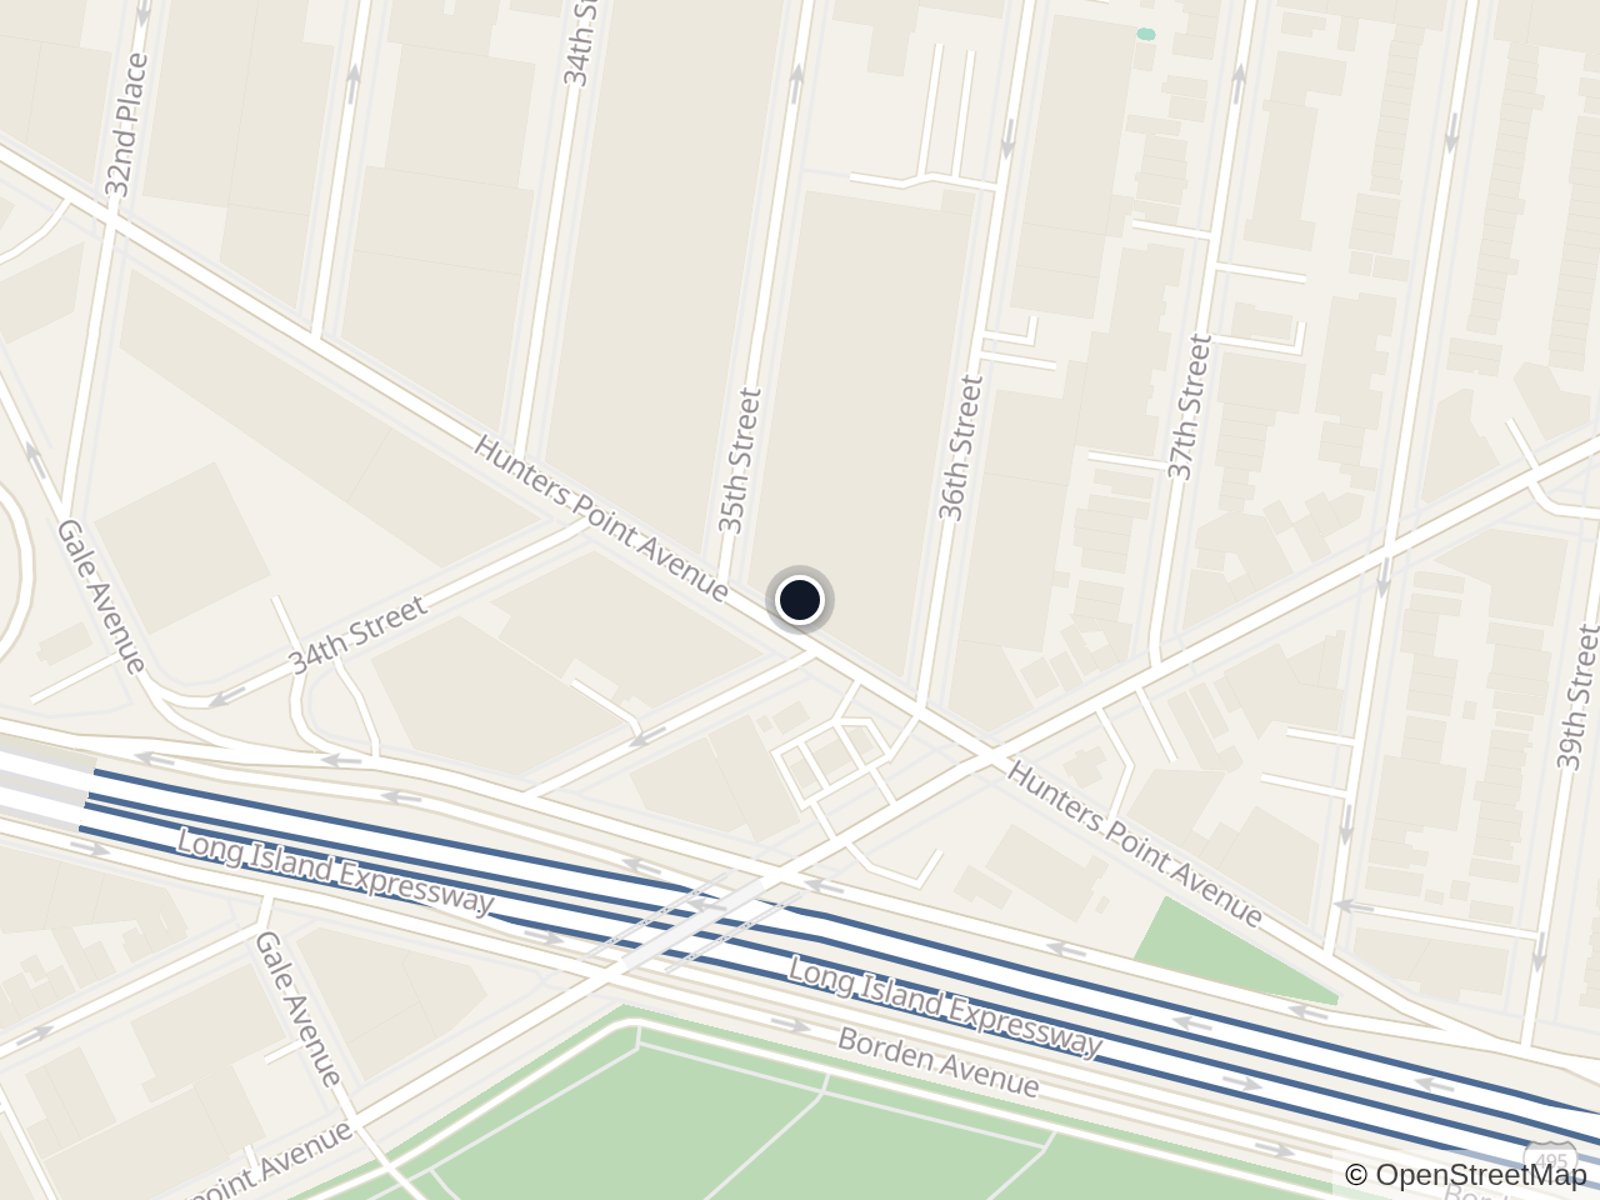
Sunnyside on the map
Notable nearby
Restaurants
- Tropical Restaurant 2359 ft
- Larcomar Restaurant Llc364 ft
- Tandoori Palace375 ft
Coffee
- Dunkin0.1 mi
- Birch Coffee HQ0.2 mi
- Kasbah Cafe0.2 mi
Bookstores
- LaGuardia Community College Library Media Resources Center0.4 mi
- Collegiate Bookstore0.5 mi
- Laguardia Library E Building0.5 mi
Nightlife & culture
- Okiku Kiyomizu Gallery0.2 mi
- The New York Times0.2 mi
- Bantry Bay Publik House0.3 mi
Shopping
- Housing Works - Warehouse211 ft
- Uniforms Today227 ft
- Vision Embroidery Inc.227 ft
Getting around
Nearest stop: GREENPOINT AV/HUNTERS POINT AV · 1 min walk
Schools nearby
- PS 199 Maurice a FitzgeraldElementary · 5 min walk
- Queens Technical High SchoolHigh · 6 min walk
- Aviation Career and Technical Education High SchoolHigh · 7 min walk
- Middle College High School at Laguardia Community CollegeHigh · 8 min walk
- International High School at Laguardia Community CollegeHigh · 8 min walk
- Robert F Wagner Jr Secondary School for Arts and TechnologyHigh · 9 min walk
Key details
The cost of homes
The median sale price in Sunnyside is $565,000, which is lower than Queens overall at $730,000—a difference of roughly $165,000. Homes typically sell between $367,500 and $1,050,000. The neighborhood is averaging $707.48 per square foot, with properties spending about 129 days on the market.
Housing stock
147 homes sold in the past year at $707.48 per square foot. Properties typically spent 129 days on market. Market activity tracks in line with Queens overall.
Nearby neighborhoods
All figures reflect sales only; rentals are excluded.
Thinking about a move in this neighborhood?
Get a personalized valuation or talk through the market with a local expert.